 |
plc.myforum.ro
PLCs users www.plc.myforum.ro!
|
| View previous topic :: View next topic |
| Author |
Message |
valz
Member 3


Joined: 26 Jul 2015
Posts: 771
|
 Posted: 14/06/2023 20:49 Post subject: WinCC Unified: Error message when calling up the Script-debu Posted: 14/06/2023 20:49 Post subject: WinCC Unified: Error message when calling up the Script-debu |
 |
|
WinCC Unified: Error message when calling up the Script-debugger
https://support.industry.siemens.com/cs/document/109779192/
How do you use the Script Debugger with WinCC Unified and the Chrome browser?
1. Behavior and possible causes
2. Remedy Enabling the Script Debugger
3. Stopping the Script Debugger
1. Behavior and possible causes
When you open the Script Debugger page, you see a blank page or the error message "TypeError: document.registerElement is not a function at Object.UI.registerCustomElement". To be able to use the Script Debugger for WinCC Unified in the Google Chrome browser, you have to enable it.
Possible causes
The Script Debugger is disabled
The Runtime has been restarted.
2. Remedy Enabling the Script Debugger
Detailed instructions for enabling the Script Debugger in the SIMATIC Runtime Manager are available in the corresponding manual: Enabling the debugger.
https://support.industry.siemens.com/cs/ww/en/view/109813308/153148230283
The following steps are executed with a case distinction regarding the version of TIA Portal Unified:
Version of your Chrome browser lower than V80.
(For the TIA RT V16 you need a Chrome browser version V55 or higher).
Version of your Chrome browser equal to or higher than V80.
(For the TIA RT V17 and higher you need a Chrome browser version V70 or higher).
Chrome lower than V80
Requirements: Your configuration is running in the started Runtime.
Start the Script Debugger by calling the address: "http://localhost:9222" in Chrome (Your port may be different).
The "Inspectable pages" page is displayed.
Select your desired context and open the "Sources" tab via "Ctrl+Shift+I" or More Tools > Developer Tools.
The Script Debugger is displayed.
Note: Update Script Debugger
Update the Script Debugger after a screen change in your Runtime or after a new Runtime load. (The Script Debugger connection is lost in both cases. Chrome displays an error message and asks to reconnect.) Repeat step 1 to reconnect.
Chrome V80 and higher
Make sure that your Runtime configuration is enabled in the started Runtime and follow steps 1-4 as shown in the following figure:
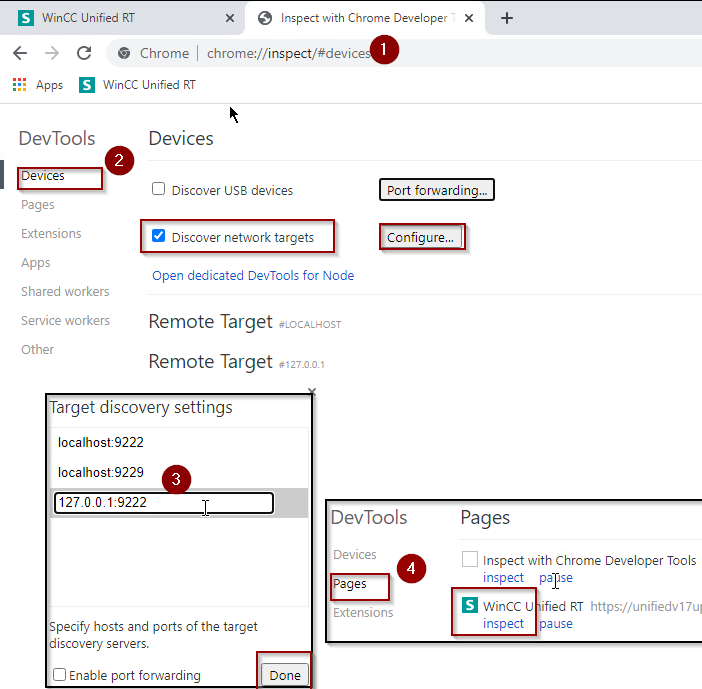
1. Start the Script Debugger by calling the address "Chrome://inspect".
2. Click "Devices", enable the "Discover network targets" option and click "Configure...".
3. Enter "127.0.0.1:9222" (your port number may be different) and click "Done".
4. Click "Pages" and then click "Inspect" on your already started Runtime.
Note on updating the Script Debugger
Update the Script Debugger after a screen change in your Runtime or after a new Runtime load. (The Script Debugger connection is lost in both cases. Chrome displays an error message and asks to reconnect.). Close the "Inspect" window to reconnect.
3. Stopping the Script Debugger
Remove all breakpoints and close the Script Debugger tab in Chrome (this will not terminate your Runtime).
Note
More information is available in the manual: SIMATIC HMI WinCC Unified Engineering V18 - Debugging scripts
https://support.industry.siemens.com/cs/ww/en/view/109813308/152546821387 |
|
| Back to top |
|
 |
|
|
You cannot post new topics in this forum
You cannot reply to topics in this forum
You cannot edit your posts in this forum
You cannot delete your posts in this forum
You cannot vote in polls in this forum
|
Powered by phpBB © 2001, 2005 phpBB Group
Fa-ti si tu propriul forum GRATUIT, pe www.myforum.ro |
 FAQ
FAQ Search
 Memberlist
 Usergroups
 Register
 Profile
 Log in to check your private messages
 Log in


