 |
plc.myforum.ro
PLCs users www.plc.myforum.ro!
|
| View previous topic :: View next topic |
| Author |
Message |
TASM33
Junior

Joined: 13 Jul 2018
Posts: 4
|
 Posted: 30/01/2019 17:47 Post subject: Library for statistical distributions in S7-1200/1500 PLC Posted: 30/01/2019 17:47 Post subject: Library for statistical distributions in S7-1200/1500 PLC |
 |
|
Library for determining statistical distributions in a S7-1200/1500 PLC
https://support.industry.siemens.com/cs/document/81662739/library-for-determining-statistical-distributions-in-a-s7-1200-1500-plc
You can use SIMATIC S7 PLCs for preprocessing measured value data. This article provides some standard functions for statistical processing and display of measured values.
As a rule, the raw data of the measured values read in by the periphery must be pre-processed in order to make statements regarding the quality. Standard functions here are statements on statistical distribution, various mean value calculations, smoothing functions, regressions, etc. In this article you will find suitable functions for the S7-1200 and S7-1500 on the PLC as well as visualization components for WinCC RT Professional.
Library "LMeasure"
To be able to process measured values from processes already in the S7-PLC, you receive a library for measured value processing.
The following blocks are contained:
LMeasure_Boxplot
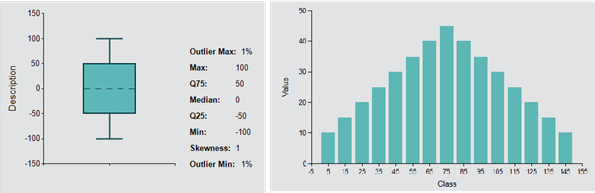
Calculates the statistical information of the minimum, 25% quartile, median, 75% quartile and the maximum value of a series of measured values necessary for the representation of a boxplot. In addition, the block calculates outlier statistics and a measure for the skewness of a distribution. A .NET Control for WinCC Professional is available for this block.
LMeasure_Histogram
Represents the frequency distribution of a series of measured values in the form of a histogram according to parameterizable classes. A .NET Control for WinCC Professional is available for this block.
LMeasure_SimpleSmoothingFC
Performs a smoothing of the measured values by calculating the linear mean value by three points.
LMeasure_SmoothByPolynomFB
Carries out a smoothing of the measured values by a 3rd degree compensating polynomial.
LMeasure_DifferenceQuotientFC
Carries out a numerical differentiation of the equidistantly sampled measured values. This function uses a 3rd degree polynomial to smooth noisy input signals.
LMeasure_RegressionLine
Calculates a linear regression with the slope and the intersection point with the Y-axis as initial parameters from a measured value data set.
WinCC-Controls "Boxplot" and "Histogram"
The two WinCC controls "Boxplot" and "Histogram" are available for visualizing the information from the blocks "LMeasure_Boxplot" and "LMeasure_Histogram".
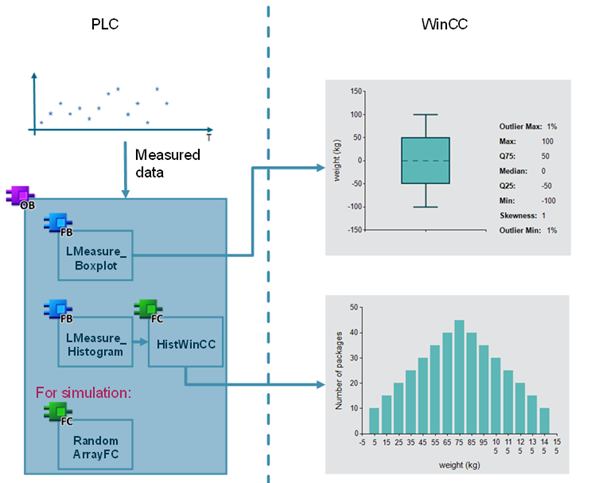
Application example for Boxplot and Histogram Components
In order to be able to make statements about the statistical distribution of measured values from a process, more complex calculations are necessary. Extensive evaluations are usually carried out on PCs with special statistics programs. The required raw data is transferred from the S7-PLC. If you want to display the evaluations with WinCC Runtime Professional, you can create your own .Net Controls with Visual Studio.
This application example shows you how to integrate the WinCC controls "Boxplot" and "Histogram" into your project and how to supply data using the blocks "LMeasure_Boxplot" and "LMeasure_Histogram". In order to draw a Boxplot or a Histogram the data must be prepared. This function is performed by the blocks "LMeasure_Boxplot" and "LMeasure_Histogram".
Downloads Library "LMeasure
https://support.industry.siemens.com/cs/attachments/81662739/81662739_Measurement_Library_DOC_V10_en.pdf
https://support.industry.siemens.com/cs/attachments/81662739/81662739_Measurement_Library_CODE_V10.zip
WinCC-Controls Boxplot and Histogram
https://support.industry.siemens.com/cs/attachments/81662739/81662739_WinCCNetControls.zip
Application example for Boxplot and Histogram Components
https://support.industry.siemens.com/cs/attachments/81662739/81662739_Boxplot_Histogram_DOC_V10_en.pdf
https://support.industry.siemens.com/cs/attachments/81662739/81662739_Boxplot_Histogram_CODE_V10.zip |
|
| Back to top |
|
 |
gert
Member 3


Joined: 02 Jan 2015
Posts: 645
|
| Posted: 06/11/2019 22:18 Post subject: statistical distributions in a S7-1200/1500 PLC |
|
|
Library for determining statistical distributions in a S7-1200/1500 PLC
https://support.industry.siemens.com/cs/document/81662739/library-for-determining-statistical-distributions-in-a-s7-1200-1500-plc
Downloads tia v15.1
Library "LMeasure"
https://support.industry.siemens.com/cs/attachments/81662739/81662739_Measurement_Library_DOC_V12_en.pdf
https://support.industry.siemens.com/cs/attachments/81662739/81662739_Measurement_Library_CODE_V12.zip
WinCC-Controls Boxplot and Histogram
https://support.industry.siemens.com/cs/attachments/81662739/81662739_WinCCNetControls.zip
Application example for Boxplot and Histogram Components
https://support.industry.siemens.com/cs/attachments/81662739/81662739_Boxplot_Histogram_DOC_V10_en.pdf
https://support.industry.siemens.com/cs/attachments/81662739/81662739_Boxplot_Histogram_CODE_V10.zip
https://ulozto.net/tam/_9Wj43Q2q9hHC |
|
| Back to top |
|
|
|
|
You cannot post new topics in this forum
You cannot reply to topics in this forum
You cannot edit your posts in this forum
You cannot delete your posts in this forum
You cannot vote in polls in this forum
|
Powered by phpBB © 2001, 2005 phpBB Group
Fa-ti si tu propriul forum GRATUIT, pe www.myforum.ro |
 FAQ
FAQ Search
 Memberlist
 Usergroups
 Register
 Profile
 Log in to check your private messages
 Log in


